

| NanoSpectralyze Software |
Included with all NanoSpectralyzer models (NS1, NS2, and NS3)
The fully integrated NanoSpectralyze software is used for system control, spectral acquisition, and data analysis
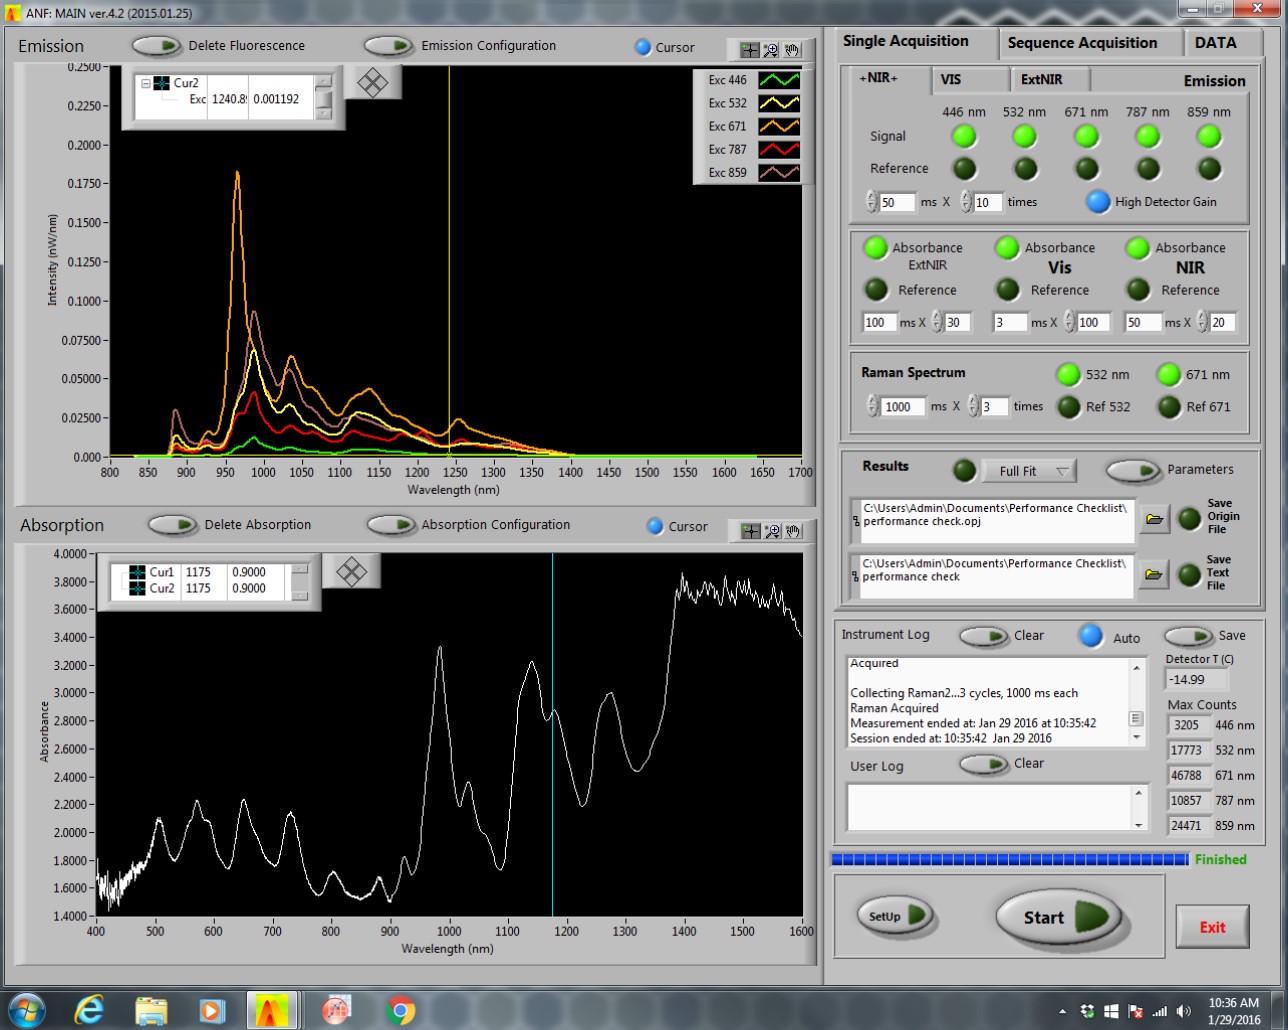
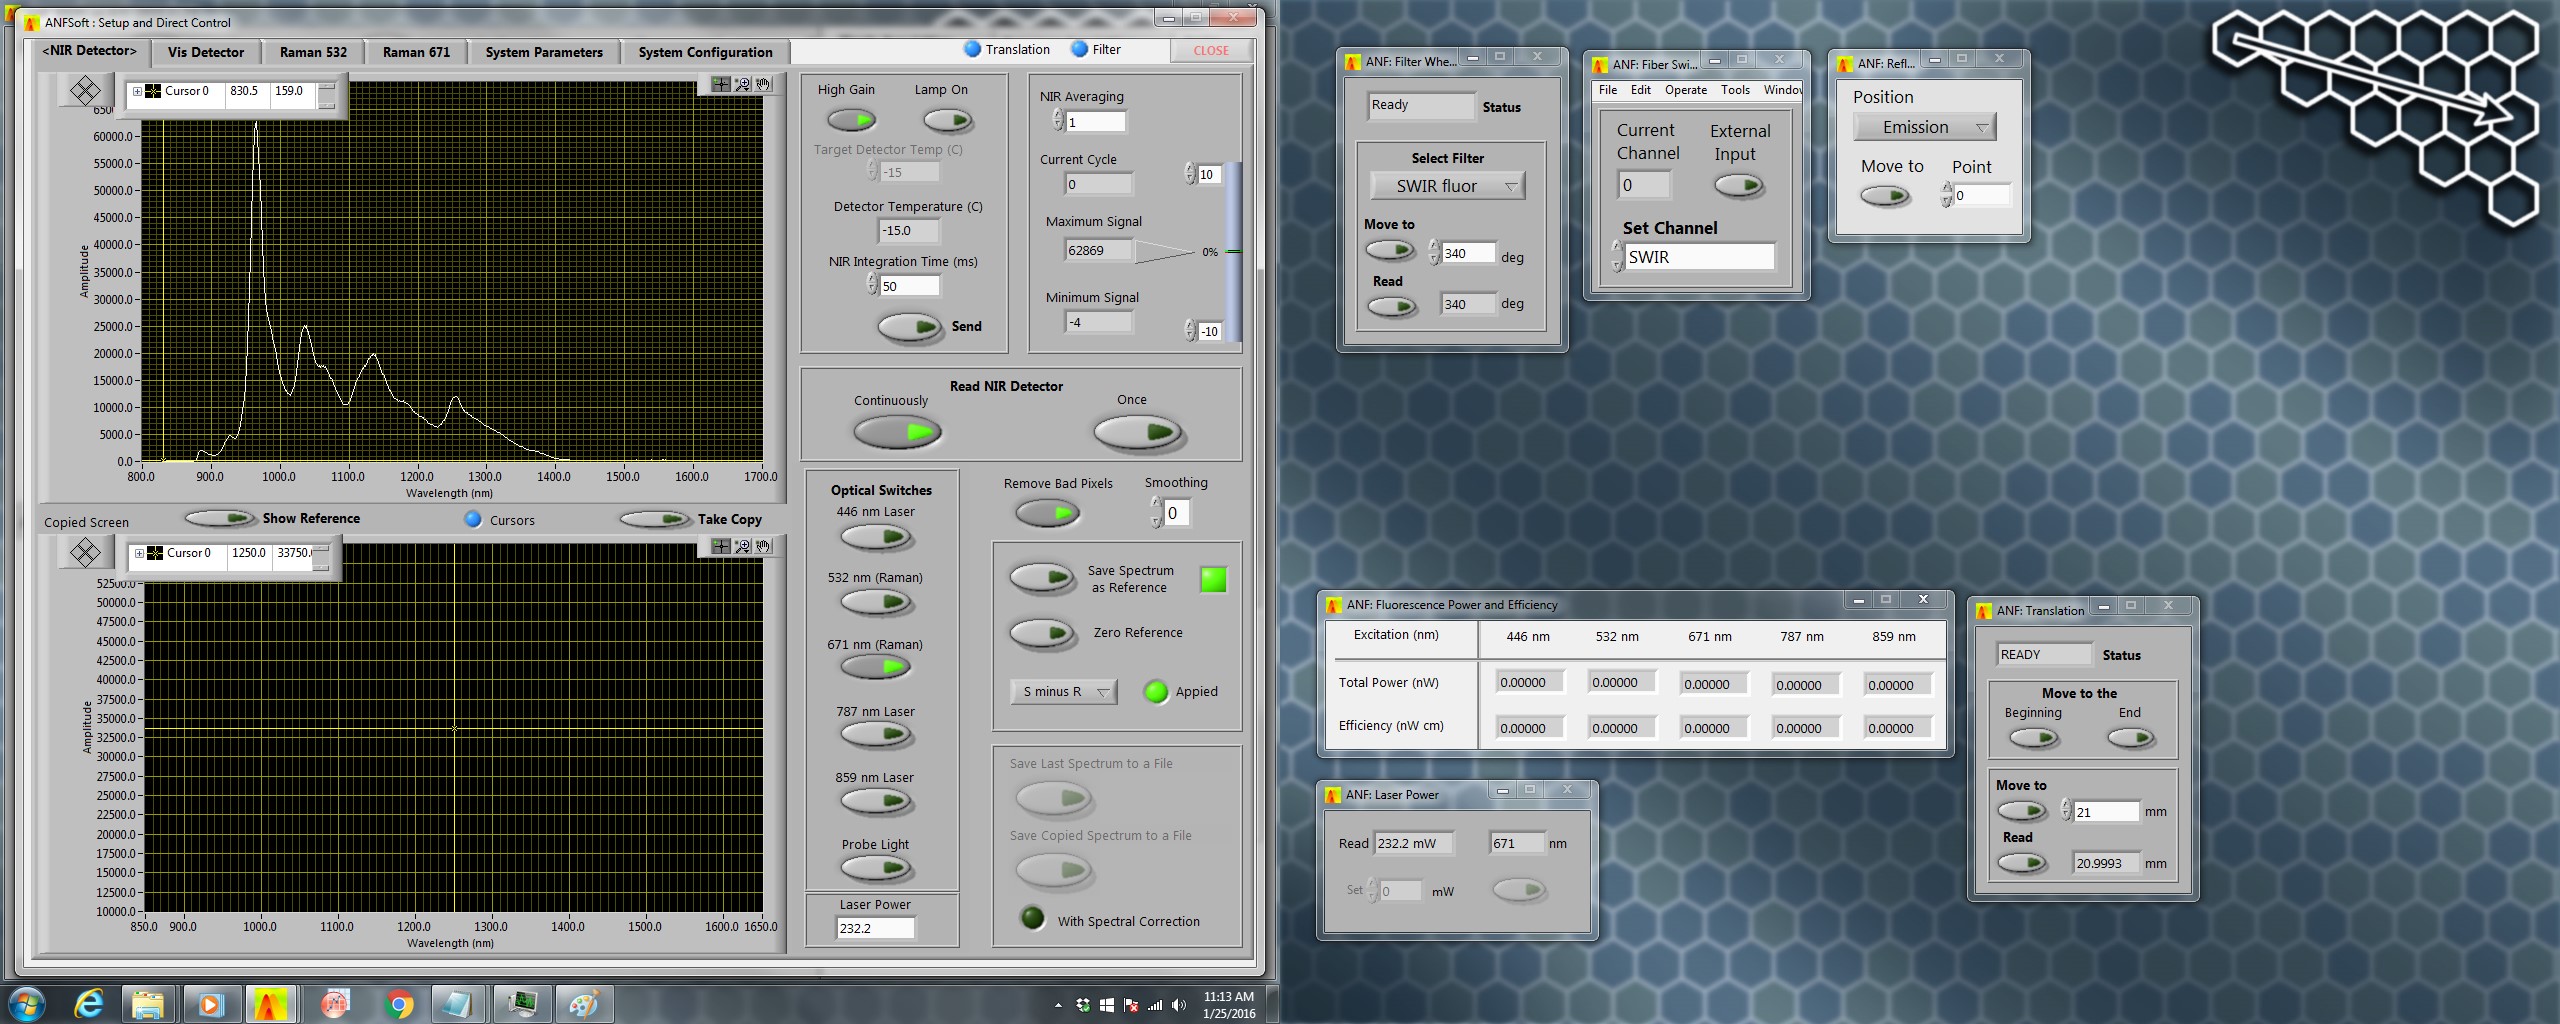
The main control screen of an NS3 NanoSpectralyzer shows some of the possible modules that can be combined to create a highly customized spectrometer for any nanomaterial research application. Some modules shown as separate tabs on the main control screen include Emission in the Visible, NIR, and Extended NIR with up to 5 different excitation wavelengths; Absorption in the Visible, NIR, and Extended NIR; and Raman with two different excitation wavelengths.
NanoSpectralyze software contains custom fitting routines to rapidly analyze the (n,m) and diameter distribution of semiconducting single-walled carbon nanotubes using their NIR fluorescence. Integrated into that fitting routine is the powerful scientific graphing and analysis software, Origin®.
NanoSpectralyzer Spectral Modes:
|
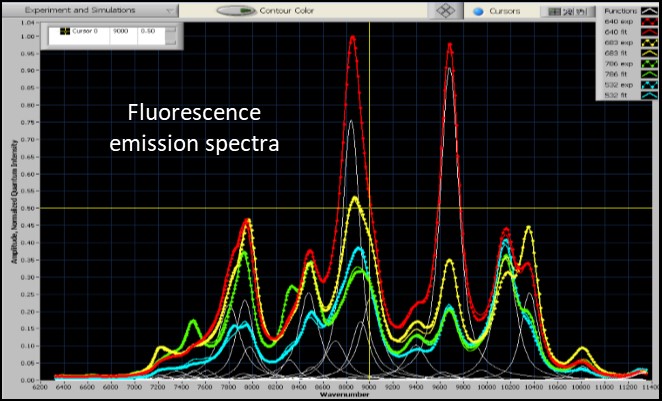
Near-Infrared Fluorescence spectra are measured using four or five excitation lasers. Very weak sample emission can be quickly recorded with high signal-to-noise ratios because of the high excitation powers, focused excitation beams, high aperture collection optics, and efficient emission spectrometer and array detector. |
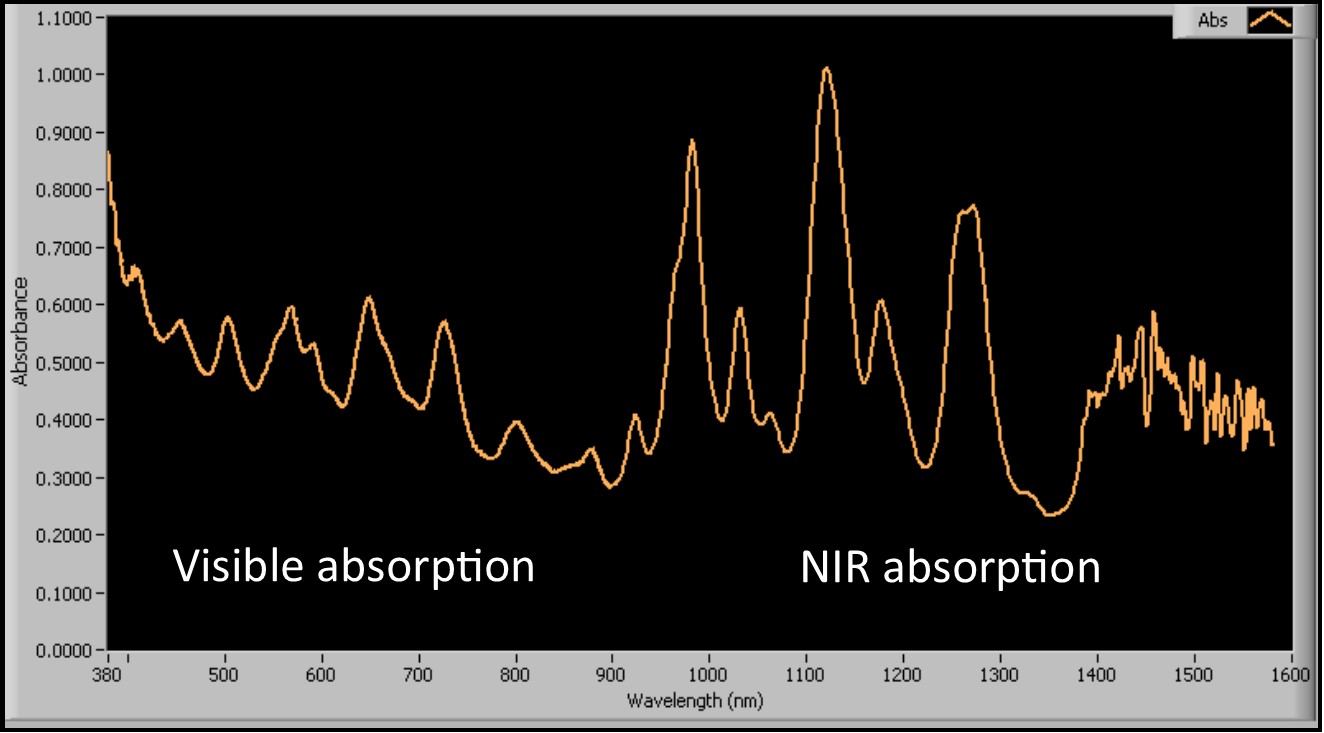
Absorption spectra are measured in single-beam mode using broadband probing light from a stabilized tungsten-halogen lamp. A 2 mm beam diameter permits the use of small sample volumes. The seamless spectra cover 410 to 1600 nm in all NanoSpectralyzers, with optional UV extension to 210 nm in the NS3. |
|
|
|
|
|
|
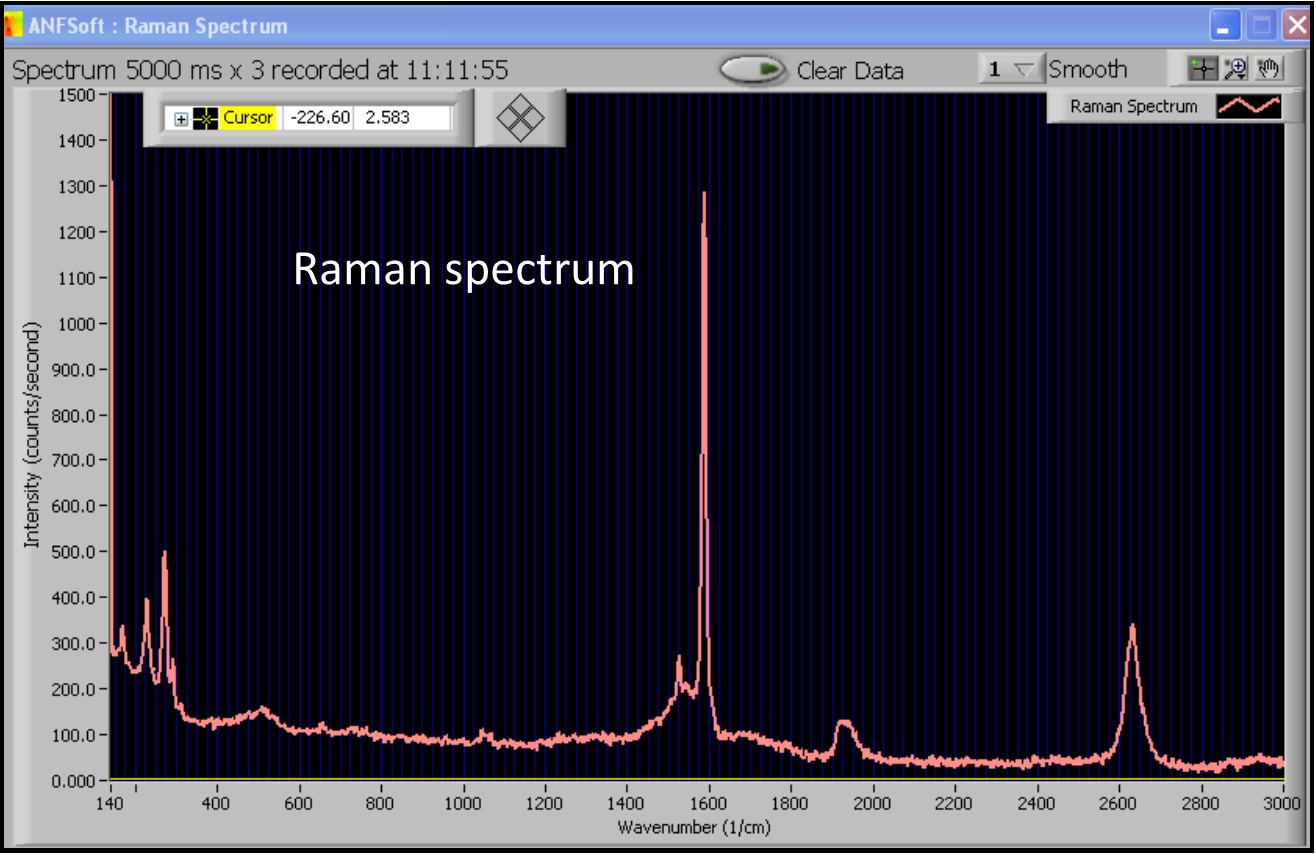
Raman spectra are available only with models NS2 and NS3. The Raman excitation wavelength(s) may be selected (on ordering) as 532 and/or 671 nm, according to customer preference. The optical configuration has been designed to provide a spectral resolution and range appropriate for spectroscopy of carbon nanomaterials (CNTs, graphene, carbon quantum dots). |
Setup Mode allows full manual control of all instrument parameters and displays raw spectra in real time. This is useful for exploratory research applications and for estimating acquisition parameters for new samples. |
|
|
|
|
|
|
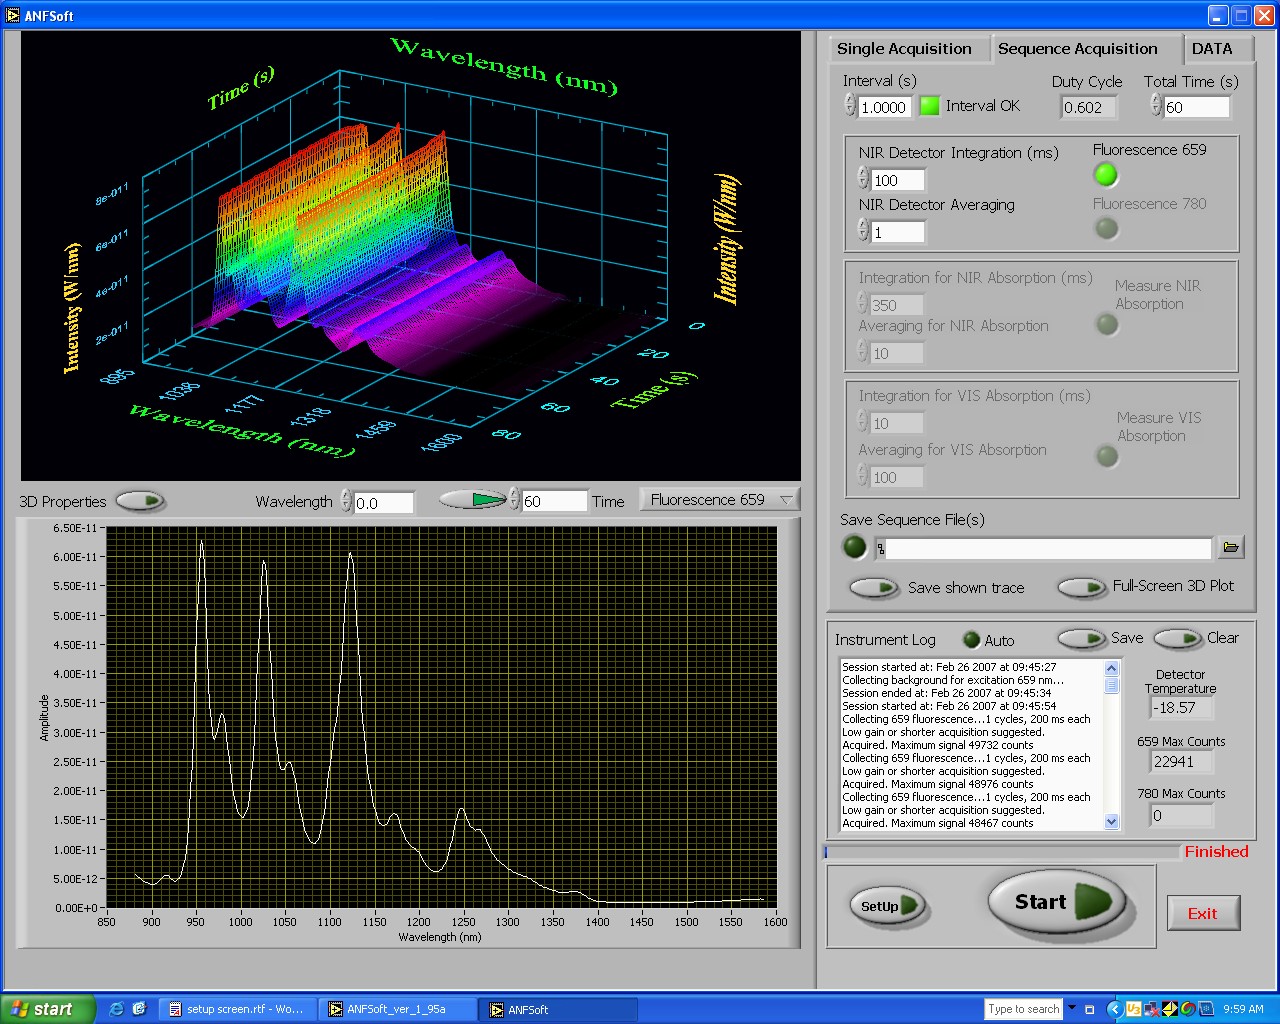
Time Sequence Acquisition Mode allows any spectral measurements to be recorded as kinetic sequences to monitor changes in sample composition or condition (for all included spectroscopy modes: fluorescence, absorption, and Raman). This mode is ideal for studying nanoparticle aggregation or chemical reactions. If a flow cell is installed, sequence mode also allows the user to monitor nanoparticles in eluent streams. Up to 10 spectra per second can be recorded. |
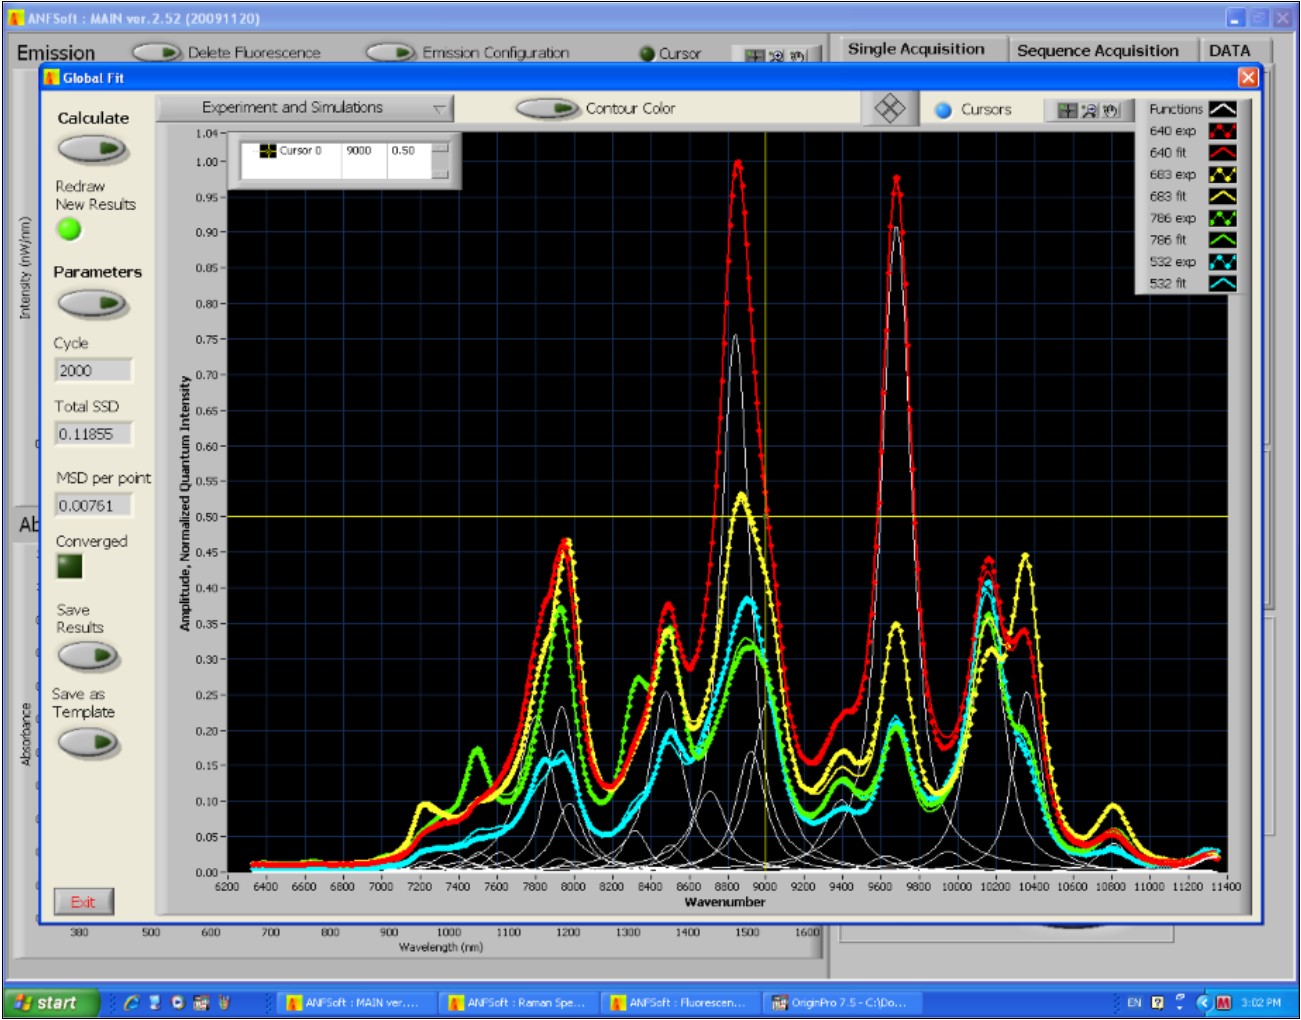
Analysis of sets of near-infrared (NIR) fluorescence spectra measured from SWCNT samples are semi-automatically interpreted by a sophisticated software module (NanoSpectralyze) that is part of the NanoSpectralyzer system. This program uses templates containing detailed spectral data on dozens of semiconducting (n,m) species. It accurately simulates the measured spectra to find the set of (n,m) concentrations that account for the observed fluorescence data. This analysis is based on current research findings in carbon nanotube spectroscopy and photophysics. For a more detailed description see the Application Notes. |
|
|
|
|
Publication Ready Graphs:
Spectral data and analysis results are automatically compiled into an Origin® project file and converted into publication-quality graphs.
|
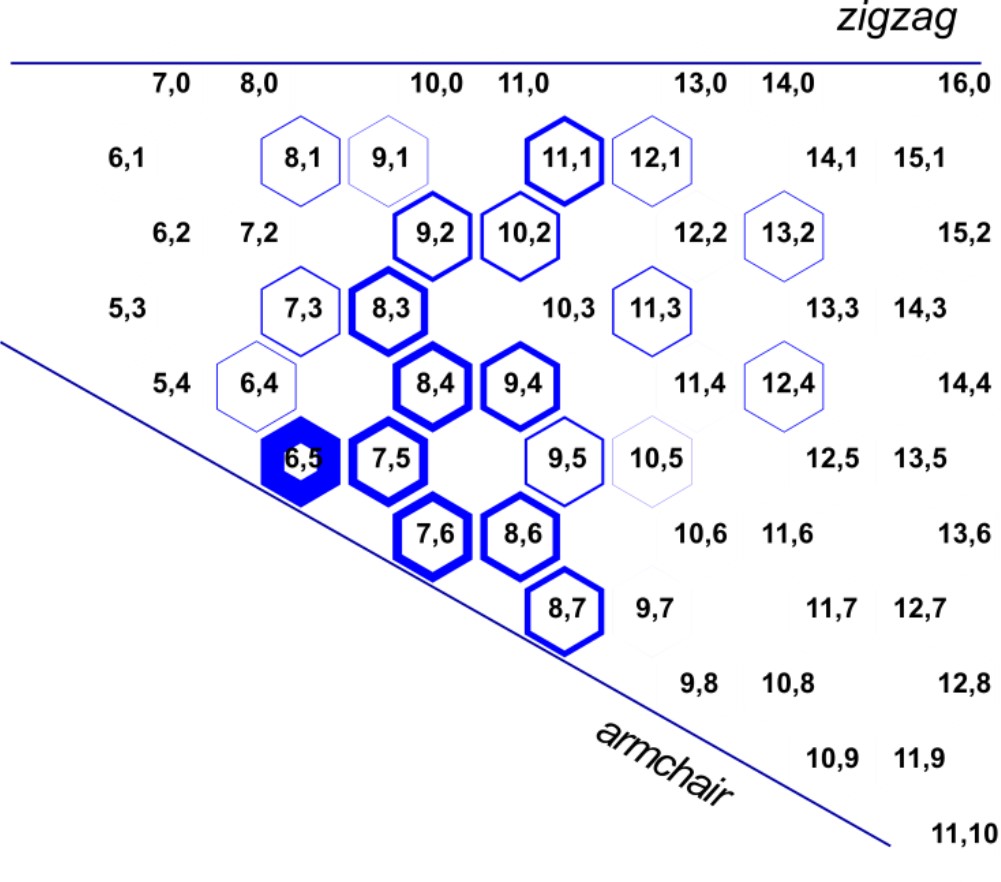
The graphene sheet plot shows the abundance distribution of different (n,m) species in an SWCNT sample. The relative abundance deduced for each species is proportional to the thickness of its hexagonal border. Results are provided with and without fluorimetric efficiency corrections. |
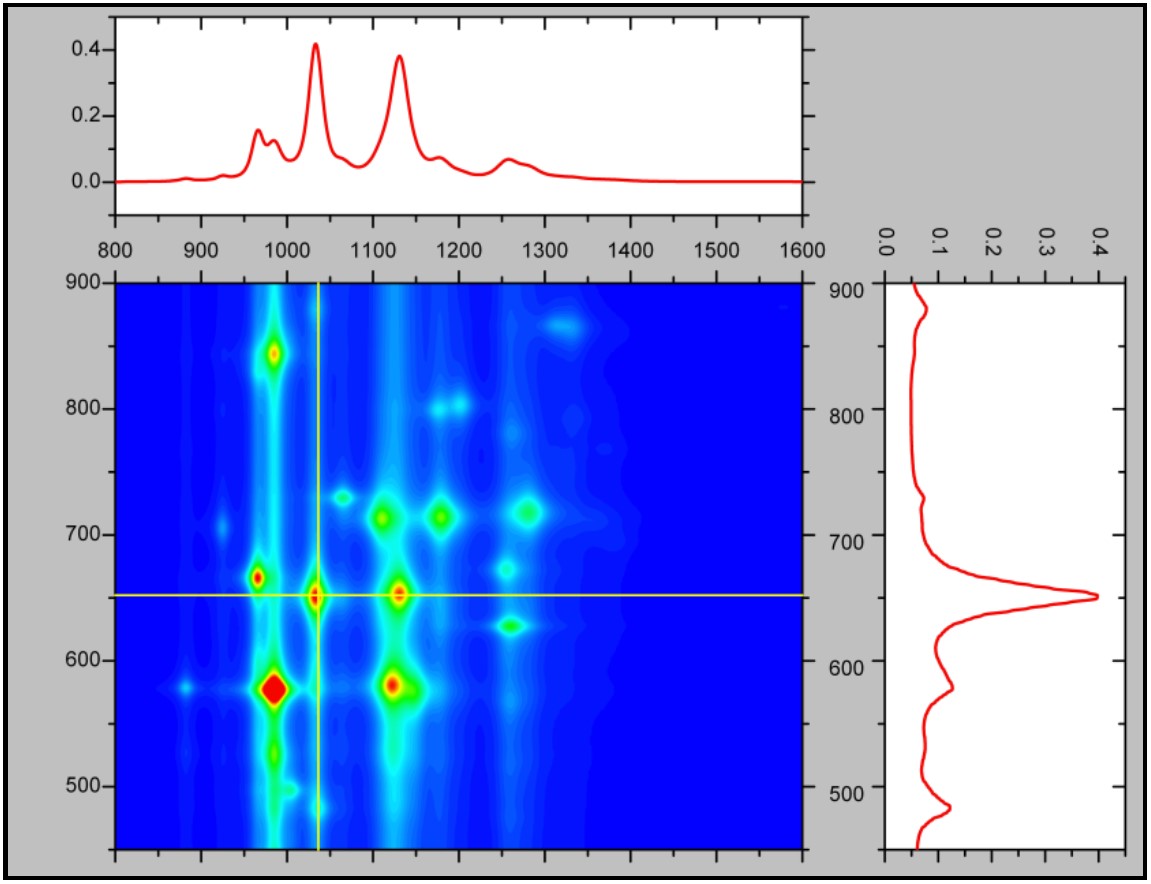
Excitation-emission contour plot - The deduced (n,m) distribution is also displayed in the form of an excitation-emission contour plot. This plot is synthesized from the discrete set of measured emission spectra and the parameters deduced from spectral analysis. |
|
 |
 |
|
|
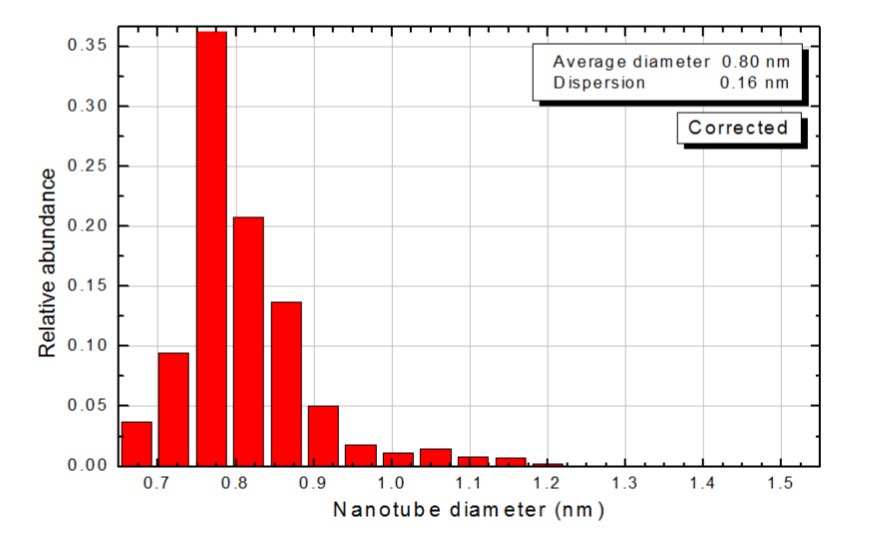
Histogram plot of the deduced diameter distribution of a SWCNT sample is automatically computed from the (n,m) distribution. The plot also displays the first and second moments of the diameter distribution. Results are provided with and without corrections for (n,m)-dependent fluorimetric efficiencies. |
||
 |